


Assessing disturbance impacts using a bio-indicator

After receiving multiple queries about the Rehabilitation and Degradation Index (RDI) discussed briefly in last weeks post I thought I would provide a bit more information.
More frequently, state and commonwealth government environment ministers have required development proponents (i.e. land developers, mining companies etc) to monitor on-going potential impacts on the biodiversity in areas adjacent to their development. It is clearly impractical, if not impossible, to monitor impacts on all fauna and flora; therefore it is necessary to select appropriate bio-indicator(s) for this purpose. The merits of using a single species, a small guild of species, a single taxonomic group (e.g. birds, reptiles, mammals or invertebrates) or a conglomerate of species has been discussed multiple times in the literature. However, the overall trend appears to be a move away from using a single or keystone species, to a composite fauna assemblage approach.
The RDI process selected reptiles as a suitable bio-indicator to measure disturbance impacts because they are relatively easy to identify, the basic ecology of most species is known, their seasonal fluctuations do not vary as much as small mammals and birds and they are relatively easy to catch.
The Rehabilitation and Degradation Index can be used for two purposes:
- measuring the success of a rehabilitation program in returning an area to a near-natural, self-sustaining functional ecosystem; or
- measuring the impact of a disturbance on the adjacent area.
In the later case, it measures the impacts of a disturbance variable such as mining, vehicle movements, agriculture, chemical sprays, invasive species or a predator on the vertebrate fauna. Three broad parameters are used in the RDI; diversity, taxonomic groups and ecological groups. Each of these parameters is divided into sub-parameters. The parameters chosen are measurable attributes of the reptile assemblage. The sub-parameter scores are weighted and summed to provide a single score between zero and the highest possible score of 100, which indicates no difference in the reptile assemblage between the control and impacts areas. If you are interested, details of the science and method of calculating an RDI score are described in Thompson et al. (2008).
To use the RDI as a tool to assess disturbance impacts, the reptile assemblage in the disturbed area and in a ‘control’ or undisturbed area is sampled. Ideally, five replica survey sites in the disturbed and control areas are required, however any number of replicates is satisfactory. Our sampling strategy would typically use a combination of pit-traps and funnel traps to catch reptiles.
Example
Below we provide a summary of an example where the RDI is being used to measure potential impacts of a mining operation on the fauna in the adjacent areas. There are three broad habitat types (i.e. sand plain; eucalypt woodland; and iron stone ridges) in the impact area; so, five long-term control and impacts sites were established in each of these habitat types.
The baseline survey was undertaken in 2008 prior to mining commencing and the first monitoring survey was undertaken in 2011. A summary of the results from the baseline survey and the first monitoring survey are shown in Table 1.
Table 1. Summary of RDI scores for the three habitat types in 2008 and 2011 (click here to enlarge)

So what does this all mean?
For the example above, a comparison between control and impact sites in the Eucalypt Woodland habitat type gave an RDI score of 83.54/100 in the baseline year (i.e. 2008) and in the first year of monitoring the RDI score was 84.57 indicating there as a slight improvement in similarity between the control and impact sites. A look are the sub-parameter scores that contribute to this overall score indicated that values for diversity, assemblage composition and ecological parameters were similar, with assemblage composition and ecological parameters scores being slightly higher in 2011 than in 2008. There is an obvious sampling error in these scores, as they are based on what animals are caught and the trapped reptile assemblage will always vary based on trap placement, ambient conditions, trapping effort, etc. It is therefore important that adequate trapping is completed to complete robust analysis.
The obvious conclusion from the first monitoring program is that the mine has not impacted on the reptilian fauna in the adjacent areas. This is an outcome that the mine was very pleased about.
Like all bio-indicators, the situation is a little more complex than is indicated in a short summary provided above, but this tool can be applied in a range of situations from measuring and monitoring the success of a mine site rehabilitation program in creating a functional ecosystem, to measuring impacts of agriculture or mining on adjacent areas, measuring the impacts of haul roads or vegetation clearing on adjacent areas, measuring the impact of chemical sprays on adjacent areas, or measuring the impact of invasive species (e.g. Cane Toad) on fauna assemblages, etc.
Could this tool be useful in your work place?

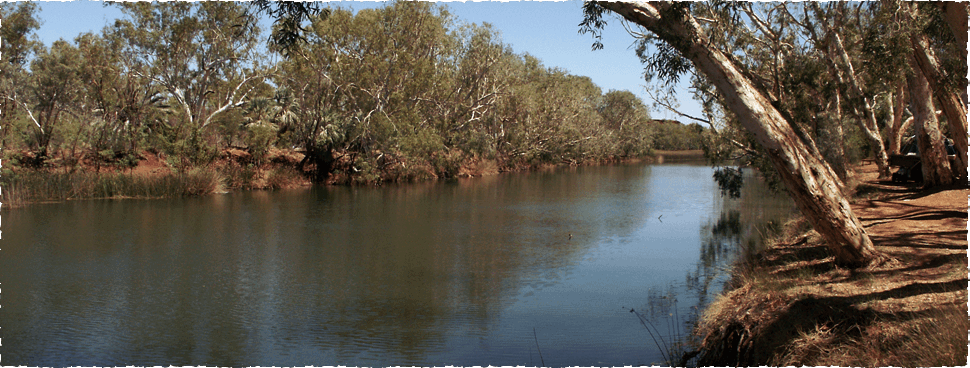
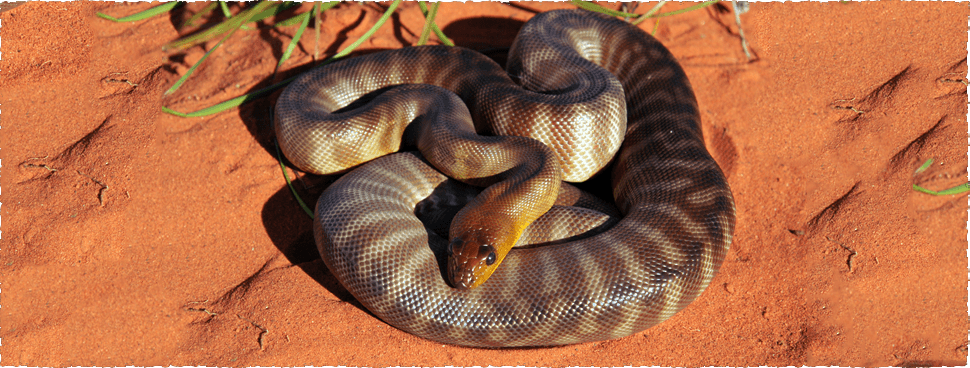
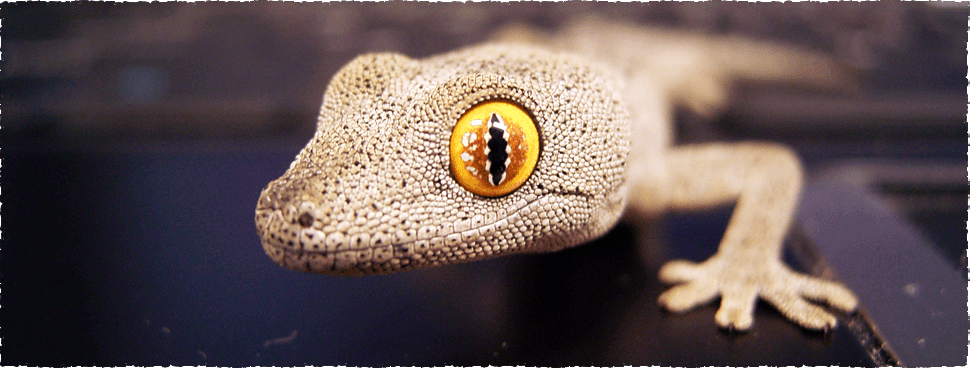
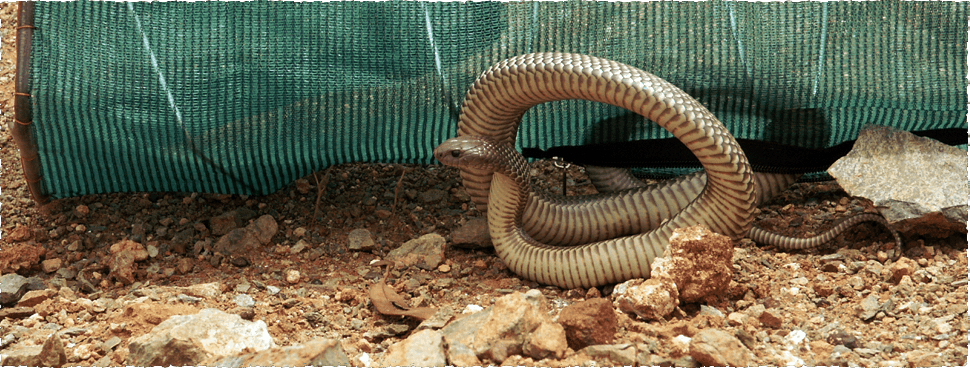
Images – top: Varanus panoptes (Yellow spotted-monitor); bottom: Partially rehabilitated goldfields mine area
Reference:
Thompson, S. A., G. G. Thompson, and P. C. Withers. 2008. Rehabilitation index for evaluating restoration of terrestrial ecosystems using the reptile assemblage as the bio-indicator. Ecological Indicators 8:530-549.

Comments
Got something to say?